MEET THE INDICATOR
The meaning behind the numbers.
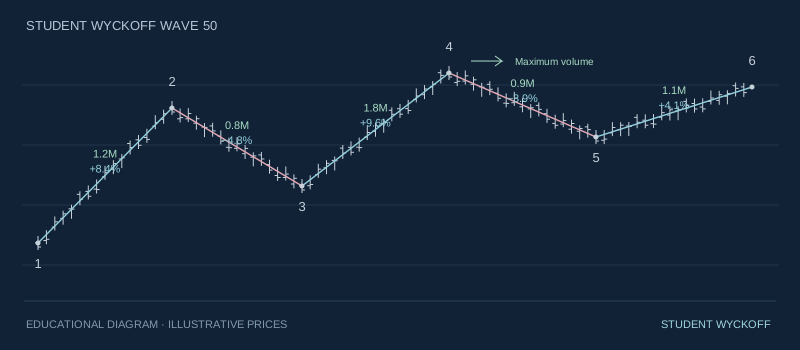
Dedicated Weiss v.4 2025 is a custom implementation of wave volume analysis using David Weis' method. The indicator divides price movement into upward and downward waves and adds measurements to them. Instead of examining individual volume bars, you observe a section's accumulated volume, duration and distance between turns. It is a tool for comparing effort and result: how much activity accompanied the move and how far price advanced.
- Two ways to set wave size
- Volume, time or both measurements together
- Bar count, E/R and ERT
- Current values, table and alerts
How waves form
The indicator connects turning points with rising and falling lines. The movement size required for a change of direction can be set in two ways: a fixed price step or a percentage of the previous wave. Changing the threshold changes the level of detail: a smaller threshold identifies shorter moves, while a larger one combines them into broader sections.
You can use closing prices or High/Low mode for the calculation. In the supplied code, the choice of high or low in this mode depends on the direction of the closing-price change relative to the previous bar. This is a specific implementation rule, so the result should not be regarded as a map of every possible intrabar turn. Start with one source and threshold before comparing different settings.
When a wave becomes complete
Historical lines and labels are created when the bar confirming the corresponding turn closes. The label itself is placed on an earlier high or low. A marker's historical position differs from the moment it became known: you cannot assume that the completed wave was already confirmed on the bar of its extreme point.
Current values on the right and the table show the developing section and can update until it is complete. In this version, the search for the extreme being confirmed is limited to 72 bars. The number of visible older lines and labels is also limited by TradingView's capabilities. The description does not promise that all markings will remain unchanged after quote revisions or a change in the start of the available history.
Volume: the effort accompanying the move
The volume label sums activity over the calculated wave. Compare upward sections with other upward sections, downward sections with other downward sections, and price reactions after sections with notable volume. If smaller and smaller advances require more volume, that is a reason to study resistance to the move more closely; the relationship alone does not establish a reversal.
Wave volume is not an exact count of purchases or sales: a section's direction and the distribution of trades by side are different things. Volume data for the selected instrument are required. Their units and quality can differ between markets; without suitable data, the figures should not be treated as a complete measure of activity.
Wave time and combined labels
Time mode shows a section's duration next to its turns. Volume + time mode displays two independent labels, so you can position them separately and compare them without merging the figures. For time, you can choose seconds, minutes, hours or days, a custom scale, the number of decimal places, and a period or comma as the separator.
A completed wave's duration is calculated from the difference between the timestamps of its start and end. This is elapsed calendar time between the points, not a count of active trading minutes: gaps between sessions can be included. In live mode, current duration is measured up to the present moment; for the last historical bar, that bar's time is used.
Bar count, E/R and ERT
Distance in bars mode shows the section's length in chart bars. In this implementation, E/R is scaled volume divided by the bar count. ERT additionally divides it by the absolute percentage change in price. These measures let you examine how much activity corresponded to the wave's duration and price advance.
Here, E/R does not automatically mean volume divided by the price range. ERT can be large when the percentage move is very small, so it is useful to compare it with price itself, volume and wave length. Changing the numeric scale also changes the displayed values of these metrics; use the same settings when comparing several sections.
The table and values on the right
The table shows the accumulated volume of the current section starting from the bar of the most recent turn confirmation. Distinguish this confirmation from the time of the earlier turning point itself: the current table and historical label do not necessarily use the same counting boundaries. You can place the table in any corner and change its colors, text size, rounding and numeric scale.
Current labels for the selected mode are available to the right of the last bar: volume, time, both measures, bar count, E/R or ERT. Their rightward offset, vertical position, color and background have separate controls. This lets you keep completed measurements near the turns and place developing values in a clear area of the chart.
Display settings for your chart
Upward and downward lines have separate color and thickness settings. Historical labels for volume, time and the other metrics have independent text colors, backgrounds, sizes and offsets for highs and lows. Current labels on the right are adjusted separately. Changing the display helps you read the markings without changing the meaning of the calculation.
Start with volume, then add time or another metric. Check the numeric scale and time units before comparing labels. If your chart has a dark background, choose contrasting text colors in the indicator settings. The shop's educational illustration shows one possible display arrangement, not TradingView's required initial appearance.
Alerts and getting started
The code provides two alert conditions: a wave high is confirmed and a wave low is confirmed. Create the alert separately in TradingView and select the condition you need. It reports the completion of a stage in the markings; it does not place a trade order or automatically identify an entry point.
Once access has been arranged, add the indicator in TradingView using the username supplied in your request. Start with one instrument, a familiar timeframe and the simple volume mode. Then compare several completed upward and downward sections: how activity, time and price advance changed. Trial access lasts one day from the agreed start.
What you receive
Access to the indicator in your TradingView account for your chosen subscription period, calculation and display settings, and email support. Source code is not included in the subscription. You need your own TradingView account; any TradingView features or paid plan required for your chosen way of working are paid for separately.
This is an independent custom Student Wyckoff implementation inspired by David Weis' approach to wave volume analysis. It is not an official product of David Weis or TradingView. The description applies to the supplied version; volume availability and history depth depend on the instrument and data provider.