GET TO KNOW THE PACK
The meaning behind the numbers.
The Larry Williams Analysis Pack brings together ten separate tools for TradingView. Each addresses its own question: how the price structure is developing, which periods stood out historically, what is happening with volume and participant positions, and whether the move is strengthening. Add the tools to your chart as needed to build a workspace around your way of observing the market. One request covers the purchase of the entire pack.
- Ten tools in one subscription
- Seasonality, structure, volume and participant positions
- Separate lines and panes below the chart
- One TradingView username and a shared access period
Included in the pack
- TDY Larry Williams Scan
- Williams POIV AD
- WILLTREND
- LW Structure
- Williams Vix Fix
- PAUNCH V.3
- OSIL LARRY + COT
- Larry Williams Blast Off
- Williams Sentiment
- WillVal
All ten tools are included in one subscription.
TDY Larry Williams Scan — seasonal windows
The scanner studies the daily history of the instrument selected on your chart and looks for recurring periods of rises or declines by trading-day number within the year. It displays up to ten qualifying options: a potential entry window, holding period, proportion of positive historical results, average change and number of observations. This is a search for seasonality in one instrument; the name Scan does not mean an automatic scan of the entire market.
You can select direction, history depth, the window of future dates and holding-period limits. Filters for year completeness and a minimum number of observations help distinguish better-supported options from small samples. A high proportion of successful cases describes the past and does not promise the same result in the next period. First check the years covered and number of observations, then compare the seasonal window with the current chart.
Williams POIV AD — price, volume and open positions
POIV AD combines an accumulated assessment of price change with OBV, a line that adds volume when the closing price rises and subtracts it when the closing price falls. In the main calculation, the change in the close is divided by the bar's true range, which accounts for the gap from the previous close, and multiplied by open interest. Open interest is the number of contracts that have not yet been closed; it is not the same as trading volume.
For open-interest mode, first add its source to the chart, select the corresponding line and confirm your selection in the settings. The line remains hidden until the source is confirmed. A separate mode uses regular volume instead of open interest. Observe the line's direction and its alignment with price; a divergence calls for study and does not automatically mean a reversal. Accumulated values depend on the start of the available history.
WILLTREND — direction and an adaptive reference line
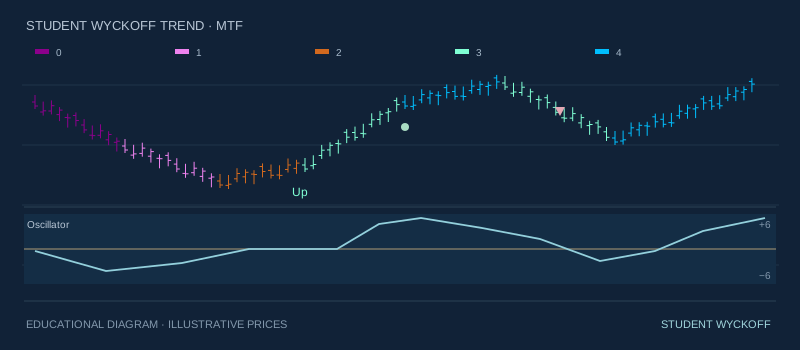
WILLTREND draws a stepped line that follows price. Its calculation uses the midpoint of the range over a selected number of bars and ATR, the average size of price fluctuations. The reference line is updated according to the positions of two neighboring closes relative to the previous line, so it can hold its level during a move and adjust when conditions change.
The line color and the fill between it and the range midpoint show the calculated directional state. Price-bar coloring is enabled separately. Settings for length, the fluctuation period and the multiplier change sensitivity. The line can serve as analysis context and a reference for observing changes in the move; it does not place a stop or open a trade in your trading account.
LW Structure — from short-term turns to longer-term structure
LW Structure marks short-term, intermediate-term and long-term turning points, labeled K, S and D on the chart. A potential point has a question mark and can change before confirmation. Confirmation requires price to move strictly beyond the relevant level, without necessarily waiting for the bar to close. This distinguishes a structure that is developing from an event that has already occurred.
In the supplied version, the active D anchor is preserved through intermediate S points until its structure is broken. Features include higher-timeframe direction, a card of possible scenarios, current and historical level segments, and separate preliminary and final alerts. Historical bars do not always reveal the order of movements within an outside bar, so reconstructed history can differ from events observed in real time.
Williams Vix Fix — depth of decline from recent closes
Williams Vix Fix compares the current bar's low with the highest closing price over a selected period and expresses the difference as a percentage. A higher reading means a deeper decline relative to that reference. It is a calculation based on the selected instrument's prices, not the market VIX index or a measure of option premiums.
The supplied version includes a line, an adjustable level, markers for crossings of that level, and a choice of calculation timeframe. Confirmed higher-timeframe data mode uses an already closed bar; a new value becomes available later, not in advance. A spike helps draw attention to a stressed section of a decline, but does not by itself establish a bottom or guarantee a recovery.
PAUNCH V.3 — strength of directional movement
PAUNCH displays ADX, a measure of how pronounced a directional move is. The calculation uses positive and negative movement components, and the result is displayed as one line with thresholds and highlighting. The supplied version retains the original PAUNCH's own formula, including separate smoothing periods; it has not been replaced by another ready-made calculation.
Active highlighting can appear when either positive or negative movement predominates. Green therefore is not a buy instruction. First determine direction from price and the pack's other tools, then use PAUNCH to assess how pronounced it is. When the closed-bars-only display is enabled, the line is hidden on the current unfinished bar.
OSIL LARRY + COT — participant-group positioning
This tool combines COT data, a weekly report on futures-market participants' positions, with an oscillator for the selected group. You can follow large speculators, small traders and commercial hedgers. Available series include long positions, short positions, their sum, their difference or the share of long positions. The source is determined by the instrument or a specified report code.
OSIL LARRY shows where the selected series lies between its minimum and maximum over a specified window, on a scale from 0 to 100. You can display only the oscillator, only the COT lines or both. The window length is set in chart bars, while the underlying report remains weekly: values can repeat on shorter timeframes. The zones reflect the series' relative position, not an instant decision by all participants or a universal buy signal.
Larry Williams Blast Off — compression of the move from open to close
Blast Off compares the average size of the open-to-close move with the average bar range. A low value shows that price traveled a small distance from open to close relative to the full range. This helps identify compression sections before watching for a possible expansion in movement. A high value reflects already larger open-to-close moves.
Options include a line and histogram, zones, different averaging methods, gap handling and vertical markers on the main chart. Signal conditions can be set for entry into the low zone or for every closed bar within it. Blast Off does not show the direction of a future expansion: a rise or decline must be assessed from market context, structure and price reaction.
Williams Sentiment — where price closes within the range
Sentiment measures the average position of the closing price within the true range. The previous close is included in its boundaries, so price gaps are accounted for. The higher the line, the closer the closes are to the upper part of the range on average; the lower it is, the closer they are to the lower part. This is price behavior, not a trader survey or an analysis of news publications.
You can adjust the averaging period, upper and lower zones, midpoint and line color. The middle region helps you see shifts in balance; the extreme regions show closes consistently positioned near one side of the range. A prolonged stay in the upper zone can accompany a strong rise, so a level crossing should not be read as an unconditional sell instruction. By default, the last confirmed value is retained on an unclosed bar.
WillVal — comparison with a selected second instrument
WillVal starts with the difference between the closing prices of the main instrument and a selected second instrument. The long average of this difference is subtracted from its short average, and the result is mapped onto a scale from 0 to 100 relative to its range over a selected window. Settings let you change the second instrument, calculation timeframe, both averages and window length.
The line changes color in the upper, lower and middle regions. You can enable scale boundaries, zone fills and entry and exit alerts. The value shows the position of the calculated difference relative to its own history; it is not a price, a percentage return or an established fair value. The choice of pair matters: instruments can differ in price scale, currency and trading hours.
How to use the pack and receive access
Start with price structure and direction, then add the panes that address your question: seasonality, volume participation, participant-group positioning or the character of the current move. You do not have to enable all ten tools at once. Agreement between several readings is useful to study, but the same response to the same underlying prices does not amount to ten independent confirmations.
Submit one request for the pack and provide your exact TradingView username. Trial access lasts 24 hours from the agreed start. A 3-month subscription costs $350, and an annual subscription costs $500 for the entire pack. Cryptocurrency payment is arranged by email; access to the pack's components is granted manually for a shared period. To renew, reply to the service email.
What you receive
Access to all ten tools in the pack for a shared period in the specified TradingView account, plus email support. Tools are added separately; the pack is not one combined script. Source code is not included in the subscription. You need your own TradingView account; its plan and any required exchange data access are paid for separately.
These are independent custom STUDENT WYCKOFF implementations based on the supplied versions and Larry Williams' approaches. The pack is not an official product of Larry Williams or TradingView. Data availability and history depth depend on the instrument, quote provider and TradingView's capabilities.