Read chart axes before interpreting the bars
A bar's height needs its label and unit to mean anything.
Before describing a chart, establish what was counted and over which period. Visits, visitors and percentages of visitors are different quantities. Check the scale's starting point and the legend: visual impressions cannot replace reading the values.
What to do
- Read the title, axis labels, units and group labels.
- Write down the values and check whether the scale starts at zero.
- Describe the data literally and separately state what the chart leaves unknown.
Example
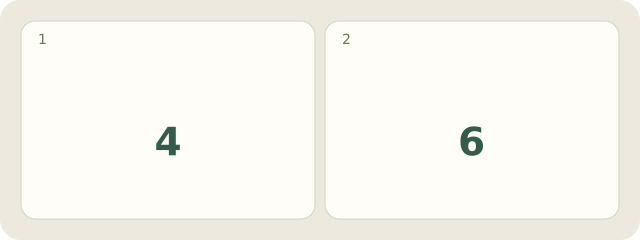
A fictional chart shows 4 and 6 library visits across two weeks. You can describe an increase in visits; the number of distinct visitors remains unknown.
My Day · Windows
In My Day, you can save a study note and your next step. You check the work yourself.