MEET THE INDICATOR
The meaning behind the numbers.
SW D-Wave is a tool for following the wave structure of price step by step, based on the D-Wave approach in the work of Thomas DeMark and Jason Perl. It identifies the stages of a directional move and the correction that follows, shows the developing structure, and helps distinguish a point that is still forming from an event that has already been confirmed. Labels are generated according to the rules of the selected calculation mode.
- Two ready-to-use approaches: Perl and DeMark
- Waves 0–5 and A–B–C in both directions
- Price reference levels and a timeframe table
- Preliminary points ? and confirmations +
How to read waves on the chart
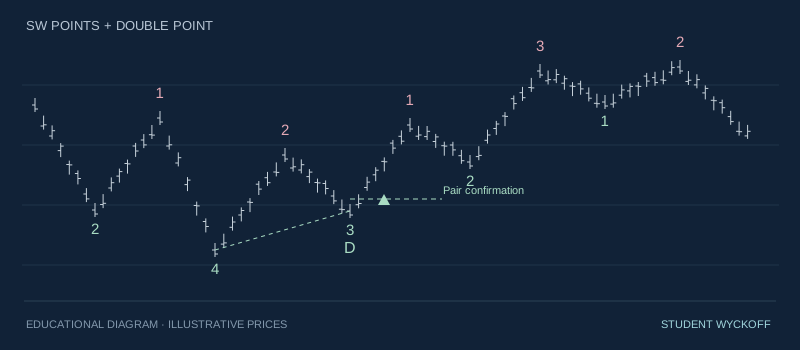
Point 0 marks the start of the structure being tracked. Numbers 1–5 help you follow its main stages, while A, B and C identify the corrective part that follows. The indicator can analyze upward and downward directions at the same time. These labels let you compare the current section with previous structures and follow the stage that is developing now.
A number or letter is placed next to the price extreme: the high or low of the corresponding section. However, that point only becomes known when the confirmation conditions are met on a later bar. You therefore need to distinguish the historical position of a label from the moment confirmation becomes available. A wave number by itself is not an instruction to enter a trade.
Two ready-to-use approaches and custom settings
Jason Perl / Bloomberg mode uses closing prices. Thomas DeMark Original mode uses bar highs and lows; the downward direction is identified as mirrored in this implementation. The approaches differ in their lookback periods, rules for how the structure develops, and price projections. You can study them on the same instrument and over the same historical section.
An experimental manual mode also lets you change the periods and rules. DeMark mode includes an optional Student Wyckoff author-defined filter: the second wave must not move beyond the start of the structure. This is a separate implementation setting. When comparing results, keep the selected mode and rules consistent so that you can understand what causes the differences.
A preliminary point and its confirmation
The ? symbol marks a preliminary point. Until the required conditions are met, it can move with the developing price extreme. The + symbol marks the bar on which confirmation occurred. In the current version, the main calculation and events take place after the bar closes. This helps you read the development of the structure separately from the moment a new confirmed event appears.
Before a cycle is complete, the selected rules may move the second or fifth wave, rebuild the corrective part, or invalidate a structure whose rules have been broken. This is part of the intended calculation process. Historical labels should therefore be studied together with preliminary points and confirmation markers, instead of treating every past number as a signal that was known at that time.
Price reference levels and movement context
The indicator calculates price reference levels from sections that have already been confirmed. The available set depends on the mode: it includes levels for individual waves and the correction, additional fifth-wave projections, and markers showing when the active level has been reached. Lines can be displayed as segments of a specified length or extended to the right, with separate controls for their color, style and labels.
A reference level is a price to watch, not a promise that the market will reach it. Additional context from RSI, a measure of momentum, lets you compare the third and fifth waves and see divergences between price and momentum. It adds context to the structure but does not replace an assessment of price itself.
Other timeframes, appearance and alerts
The table shows the upward and downward structures, their status, additional context, and the nearest active price reference level on the selected timeframes. The current version uses closed bars from the current or a higher timeframe; lower timeframes are not available in this table. Third- or fifth-wave matches across several timeframes can be highlighted separately.
Settings let you choose which points are visible, direction colors, label sizes and offsets, and the appearance of the table and price lines. Alerts can be configured for individual confirmations, the appearance and achievement of reference levels, label moves, and other selected events. Start with one of the preset modes, study ? and +, then add the elements you need. The alert itself must be created separately in TradingView.
What you receive
Access to the indicator in your TradingView account for your chosen subscription period, calculation and display settings, and email support. Source code is not included in the subscription. You need your own TradingView account; any TradingView features or paid plan required for your chosen way of working are paid for separately.
The STUDENT WYCKOFF implementation is inspired by Tom DeMark's published work. Historical profile names identify the basis of the rules. This is an independently developed product.